
General Overview
IELTS Academic Writing Task 1 overview-
How to write an introduction to IELTS Writing Task 1 (Academic)?
-
What is an overview of IELTS Writing Task 1 Academic and how to write it?
-
How to Write Body Paragraphs on IELTS Writing Task 1 (Academic)?
- Line GraphLine Graph Samples20 Exams
- Bar ChartsBar Chart Samples10 Exams
- PIE CHARTSPie Chart Samples5 Exams
- MapsIELTS Writing Academic Task 1 Maps Samples7 Exams


How to Write Body Paragraphs on IELTS Writing Task 1 (Academic)?
How to Write Body Paragraphs on IELTS Writing Task 1 (Academic)?

Writing body paragraphs on IELTS Writing Task 1 (Academic) is a tricky business. Sometimes students think that they have little information on the given chart or diagram, while other times they feel that they may well exceed the 200 words on the report.
To write body paragraphs on IELTS Writing Task 1 (Academic)
- Ensure that you categorise the data appropriately to write well-defined body paragraphs.
- Each body paragraph must have similar data in it.
- Connect paragraphs with apt linking words.
- Don’t forget to compare the data within the paragraphs and across the paragraphs.
A sample IELTS Writing Task 1 (Academic) for writing body paragraphs
In this article, our focus is on a mixed chart. A mixed chart is a combination of two graphs. They might be the same style or might be of a different kind. For instance, you may have to bar chart or a combination of bar chart and pie chart. However, the process for writing report on such charts is similar to that of other charts.
You should spend 20 minutes on this task.
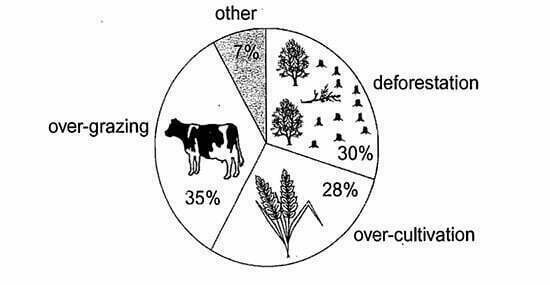
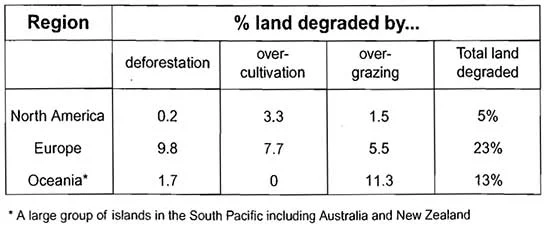
The pie chart below shows the main reason for land degradation. The table shows how these causes affected three regions of the world during the 1990s.
Summarise the information by selecting and reporting the main features and make a comparison where possible
Write at least 150 words.
As you can see on your screen, the question paper has two charts. One is a pie chart, and the other is the table. The pie chart has a small amount of information as compared to the table.
Hence, it will be treated as a minor chart. The table, on the other hand, provides a lot of scope for comparison. Therefore, it should be termed as the main chart.
Before we move further, for reference, the introduction and the overview for the given task could be as follows.
Introduction
The given pie chart and the table provide information about the percentage of land degradation around the world and in three regions. This data is for various causes of land degradation in the 1990s.
Overview
Overall it can be seen that all the three causes that are Deforestation, over-grazing and over-cultivation had a comparatively higher impact in the European continent than the other regions. However, region-wise the leading cause of degradation was different. On the other hand, worldwide, these reasons affected the almost equal share of the area.
Writing body paragraphs for IELTS Writing Task 1 (Academic)
In charts like this, we will write two body paragraphs; each is describing one chart.
The first body paragraph will be about the chart with less information, that is the minor chart. The second body paragraph then obviously will be about the main chart.
In this case, there are only 3 categories in the main chart or table: North America, Europe and Oceania. In case, there are more than 4 categories in the main chart; then you may have to divide the categories into two paragraphs. Thus, there may then be a total of three body paragraph. However, that is a rare case, so keep in mind to just write two body paragraphs, one for each chart.
How to decide how many body paragraphs to write in IELTS Writing Task 1 (Academic)?
In general, many students get stuck on how to decide the number of body paragraphs to write on IELTS Writing Task 1.
Well, it depends on the chart at hand.
Dynamic Charts
I hope you remember that data changes with time in dynamic charts and hence you may observe a trend for any given data. So, you may decide to write about all those things increasing in one body paragraph while those which are decreasing in the other.
Static Chart
In these charts, you will see some quantitative data that is highest and some which is lowest. So, you can write the two body paragraphs accordingly.
Mixed Charts
Mixed charts have two different diagrams: one minor and other major. You may write two body paragraphs with one describing a major chart while the other describing minor chart.
Maps
If you write a report on maps, you will notice the change of a map of a geographic area over time. So, you may two or three versions of the same place. You may dedicate one body paragraph for each version.
Processes
Lastly, while encountering processes, you must find common aspects of the various steps in the processes. Based on the number of these commonalities, you may write the body paragraphs.
Writing the body paragraph 1 for IELTS Writing Task 1 (Academic)
For minor chart, you should only discuss the features and the corresponding statistics. This is because there is a minimal amount of information on it. You won’t have changes in the data concerning the time or categories.
As the total amount of land degradation is highest in Europe, then in Oceania, and the least in North America, we should mention them in the same sequence.
How to begin the body paragraph 1 for IELTS Writing Task 1 (Academic)?
The paragraph should start with an introductory sentence or phrase. This sentence will help the reader to understand the role of the section. Then the question arises how to think about the initial sentence or phrase for the first body paragraph?
The sentence should be used in a way that it maintains the flow of information from the previous paragraph. In the current sample’s overview paragraph, we used the last sentence, which said that worldwide the three causes affected the almost equal share of land.
But, the first detail in the body paragraph one is going to be about the highest value element which kind of contradicts the information in the overview paragraph. Hence, we will start paragraph one with the phrase ‘Having said that’ which tells the reader that we are about to contradict what we said a moment ago.
So, you could write
Having said that, a detailed inspection of worldwide statistics, however, reveals that among the three reasons, the slightly higher impact was of over-grazing which damaged 35% of land worldwide.
The next sentence on body paragraph 1 for IELTS Writing Task 1 (Academic)
Then you may write about the remaining two reasons for land degradation: over-cultivation and over-grazing. And add another sentence for other sources of it.
On the other hand, due to over-cultivation, the land degraded was on 5% lesser area than overgrazing while deforestation affected the almost equal share of land as over-cultivation. Lastly, only 7 percent of the land was degraded due to some other reasons.
Writing the body paragraph 2 for IELTS Writing Task 1 (Academic)
How to begin the body paragraph 2 for IELTS Writing Task 1 (Academic)?
Move to the second body paragraph, which should again start with an introductory sentence or phrase. The previous paragraph was about the effect of the three causes of land degradation worldwide. So, the initial sentence, which points out that the details, is now stated for three regions for the same reasons.
So, you could write the following sentence.
On the flip side, the three reasons for land degradation had a variable effect among the three regions.
In the next sentence explain about Europe, a geographical region most affected. Also, ensure that you explain the percentage contribution of each source of land degradation.
The largest impact was noted in Europe where a total of 23% of the land was no longer fertile out of which highest impact was of deforestation (9.8%) followed by over-cultivation and overgrazing.
After that, you may present the remaining geographies with similar statistics.
Further, 13% of land lost productivity in Oceania with the leading cause being overgrazing (11.3%) and the second reason being deforestation. No amount of land was affected due to over-cultivation in this region. Lastly, the smallest percentage of land lost its quality in North America (5%). The highest share of land was affected due to over-cultivation followed by overgrazing and least was due to deforestation (0.2%) with a two times difference in percentage share of land devastation by the three causes.
I hope you have understood how to write body paragraphs on IELTS Writing Task 1 (Academic)
Responses