
General Overview
IELTS Academic Writing Task 1 overview-
How to write an introduction to IELTS Writing Task 1 (Academic)?
-
What is an overview of IELTS Writing Task 1 Academic and how to write it?
-
How to Write Body Paragraphs on IELTS Writing Task 1 (Academic)?
- Line GraphLine Graph Samples20 Exams
- Bar ChartsBar Chart Samples10 Exams
- PIE CHARTSPie Chart Samples5 Exams
- MapsIELTS Writing Academic Task 1 Maps Samples7 Exams


IELTS Academic Writing Task 1 overview
To enter a foreign university or work abroad, you must pass the international IELTS exam. IELTS Writing is considered one of the most difficult aspects of the exam. In this article, you will find practical tips for preparing for the IELTS writing exam, examples of completed assignments, basic vocabulary and a set of grammar constructions to help you get a high score.
General information about IELTS Writing task 1 Academic module
In the first part of the written assignment, the candidate needs to describe a graph, chart, table or map in 20 minutes in 150 words. The description includes an analysis of the main changes in the indicators in the illustration, a comparison of data and a summary of information. Expressing your own opinion is not required.
There are 8 main types of tasks in IELTS academic Writing task 1, simplyielts.com will come across all of them (examples are taken from the IELTS Writing Task 1 Academic Module).
IELTS Academic writing Task 1 tests your ability to look at visual information in a graph, chart, table or diagram, and identify and report the most important information in your own words.
Types of IELTS Academic Writing Task 1
| Task type | Example |
|---|---|
| line graph | 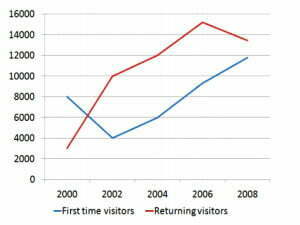 |
| pie chart | 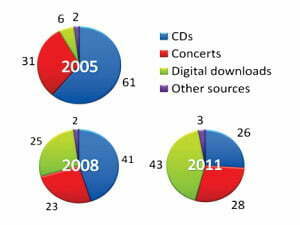 |
| bar chart | 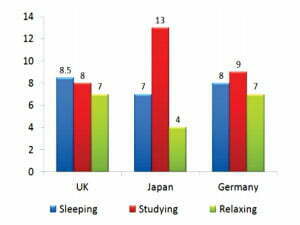 |
| table | 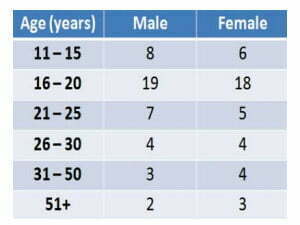 |
| map | 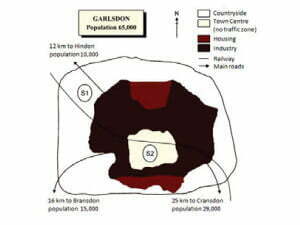 |
| process | 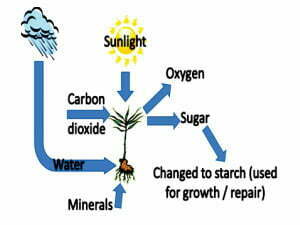 |
| mixed type – combined task | 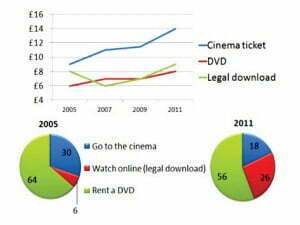 |
| flow chart | 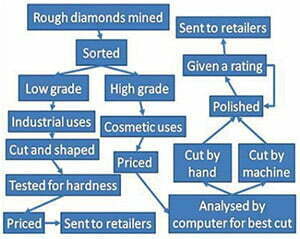 |
IELTS writing task 1 academic exam structure:
1. Introduction – 1-2 sentences
The first sentence in the introduction should report the period, place, and object of the description. Examples of introductory phrases are given in the following table.
| phrase |
|---|
| the table shows changes in |
| the table gives information about |
| the bar chart compares |
| the graph illustrates |
| the chart shows data about |
| the figure shows how smth is produced |
It will be easier to write an introduction by paraphrasing the task, for this use synonyms, for example:
graph → line graph
chart → bar chart
diagram → figure
to show → to describe, to illustrate, to demonstrate
proportion → percentage
information → data
the number of → the figure for, the proportion of
people in the UK → the British
from 1999 to 2009 → between 1999 and 2009 / over a period of ten years
in three countries → in the UK, France and Spain
2. Summary – 2-3 sentences that summarize the main characteristics of the image
The summary can be placed immediately after the introduction (in the same or a separate paragraph) or at the end of the work. To write a summary, you need to analyze the general nature of changes in the image over the entire period and highlight the main trends. If the indicators varied all the time, it is better to choose another way – to indicate the highest and lowest indicators.
Let’s look at a list of words that will help you start your writing task 1:
| Word/Phrase |
|---|
| as can be seen from the graph |
| it can be seen from the graph that |
| the graph shows |
| it can be concluded from the graph that |
| from the figures it can be inferred that, from the statistics it can be inferred that |
| the graph illustrates |
| it is noticeable that |
| we can see that |
| it is clear that |
| overall |
| it is clear from the … that |
3. Paragraph – the main part (2-3 paragraphs of 6-7 sentences each) with a detailed analysis
To write a good paragraph, follow these tips:
- analyze information about each change;
- pay attention to the highest/lowest scores in each category;
- compare indicators;
- select key information and divide it into paragraphs, put similar trends in one paragraph;
- do not describe all trends, only key ones;
- do not explain what is happening, only analyze and describe.
1. line graph
Let’s look at how to describe the IELTS line graph in IELTS writing task 1 academic.
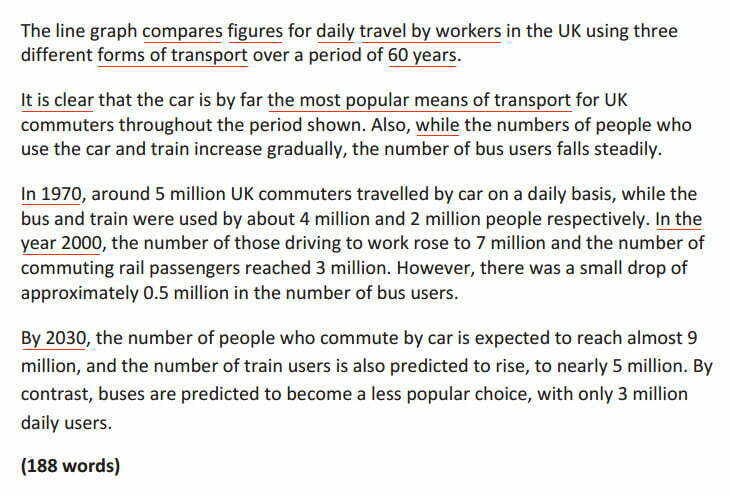
IELTS Academic writing Task 1 Line Graph Answer Sample
Structure
Introduction
The author paraphrased the task using synonyms, avoiding tautology:
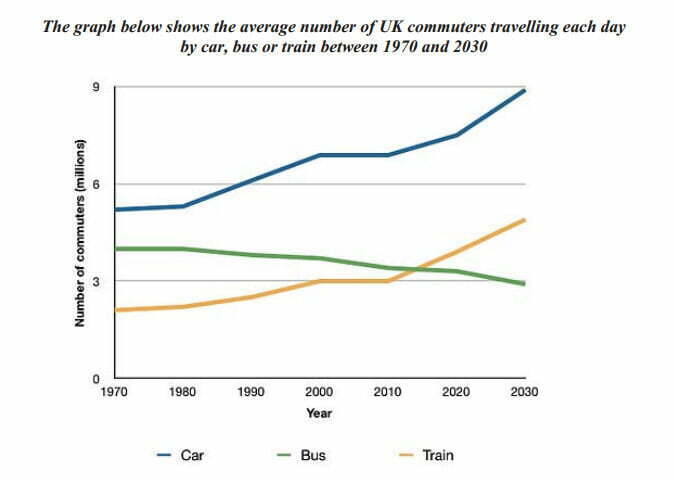
shows → compares
number → figures
each day → daily
commuters → travel by workers
car, bus or train → forms of transport
between 1970-2030 → 60 years
Summary
The summary begins with the phrase it is clear, it does not contain factual information, only general features. Two main trends are mentioned here: the most popular mode of transport and the main changes in quantity.
Paragraphs 1 and 2
The division into paragraphs was carried out according to the time criterion: the past years were placed in one paragraph, and predictions in another.
Vocabulary
To describe a line graph, the candidate will need vocabulary that characterizes changes in trends. We have identified the main verbs:
| Word/Phrase |
|---|
| to rise, to increase, to grow, to climb, to boom, to peak (to reach / hit a peak), to rocket, to surge, to go up |
| to fall, to drop, to decrease, to reduce, to decline, to dip, to plummet, to plunge, to go down, to reach the lowest point, to hit the bottom |
| not to change, to remain stable, to remain steady, to stay constant, to stand steady, to maintain the same level, to remain unchanged, to plateau |
| to level out |
| to fluctuate, to oscillate, to be volatile |
Almost each of these verbs can be formed into a noun, which will allow varying grammatical structures.
| Verb | Noun |
|---|---|
| to rise | rise |
| to reduce | a reduction |
| to remain stable | a period of stability |
| to stabilize | a period of stabilization |
| to level out | a leveling out |
| to fluctuate | a fluctuation |
| to oscillate | an oscillation |
| to be volatile | a period of volatility |
Appropriately chosen adjectives and adverbs will help to give a more accurate assessment of trends or describe changes in the smallest detail:
| Adverb | Adjective |
|---|---|
| abruptly, sharply, enormously, steeply, substantially, considerably, significantly – strongly, sharply, significantly | dramatic, sharp, enormous, steep, substantial, significant, significant – strong, sharp, significant |
| rapidly – quickly and in a short time | rapid – fast |
| moderately, mildly – moderately, slightly | moderate, mild – moderate, slight |
| gradually, slowly – gradually, slowly | gradual, slow – gradual, slow |
| slightly – easy, a little | slight – light, small |
| minimally – minimally | minimal – minimal |
| partially – partial | partial |
Grammar
The main difficulty in describing a line graph can be the correct use of prepositions. For example, to increase by 10% in English would be to increase by 10%, not on 10%.
We have identified the main cases of using prepositions to describe changes:
- use to to report how the amount has changed – to increase to 100 (increase to 100), to fall to 20% (fall to 20%);
- use by to show the difference – to decrease by 10% (decrease by 10%);
- use at to specify the amount – the number of X peaked, at 90% (the amount of X peaked at 90%), Y remained stable at 15% (Y remained unchanged at 15%);
- from … to is used to indicate a range – from 1996 to 2019 (from 1996 to 2019);
- after nouns such as a decline, an increase, a climb, the preposition of is used to clarify the percentage (of 30%), then the preposition in to show what the changes were – there was a sharp decline of 40% in the number of children (the number of children has sharply decreased by 40%);
- after words describing fluctuations, you can use between … and – there were considerable fluctuations between 5 and 6 million (there were serious fluctuations between 5 and 6 million);
- before the years we use in – in 1996 (in 1996).
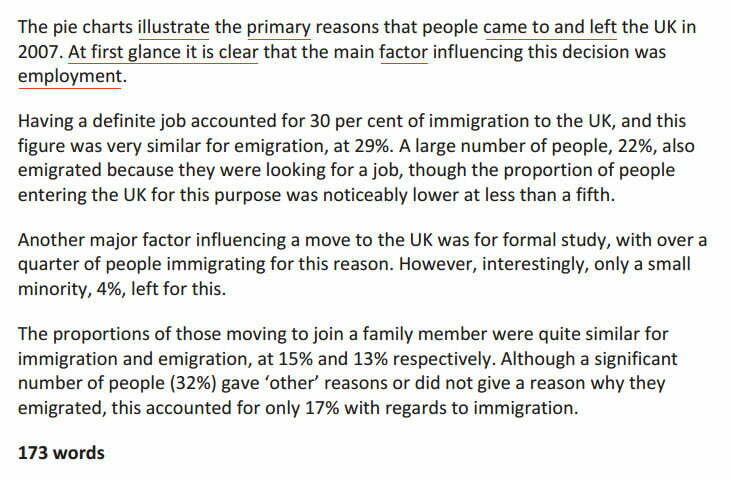
IELTS Academic writing Task 1 Pie chart
Consider an example of describing a pie chart.
IELTS Academic writing Task 1 Pie Chart Answer Sample
Structure
Introduction and summary
The first paragraph combines the introduction and summary. The summary begins with the words at first glance it is clear. Let’s see how the task is rephrased and what synonyms are used:
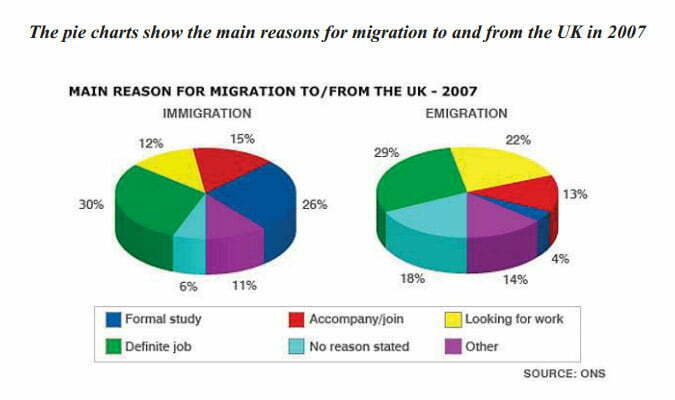
show → illustrate
the main → the primary
migration to and from → came to and left
reason → factor
definite job → employment
Paragraphs 1, 2, 3
According to the criterion of the reasons for immigration and emigration, the letter was divided into three paragraphs. At the same time, only the main reasons are singled out – work, study, family. Note that immigration and emigration are not described in separate paragraphs.
Vocabulary to describe pie chart in IELTS Academic writing Task 1
When describing a pie chart, the candidate mainly works with percentages. The table contains useful vocabulary.
| Word/Phrase |
|---|
| the proportion of |
| the percentage of |
| a large number of |
| over a quarter of people |
| a significant number of people |
| a very large majority |
| a significant proportion |
| a minority |
| a very small number |
| one in twenty (5%) |
| one in ten (10%) |
| less than a fifth (15%) |
| a fifth (20%) |
| quarter (25%) |
| less than a third (30%) |
| more than a third (35%) |
| two fifths (40%) |
| half (50%) |
| just over |
| nearly, nearly, almost, about, roughly |
| just under |
To talk about quantity, you first need to understand the difference between number and amount. Number is used with countable nouns and can be followed by a singular or plural verb. In the singular, the translation is “the amount of something / someone”, in the plural – “a large amount of something / someone”. Amount is used with uncountable nouns. Accordingly, the verb is used only in the singular.
The number of people was gradually decreasing. — The number of people gradually decreased.
A number of services were improved. – A large number of services have been improved.
A significant amount of money was spent on accessories. — A significant amount of money was spent on accessories.
Instead of number and amount, you can use the word proportion. It is used with both countable and uncountable nouns.
The proportion of young people listening to rock is higher than of those listening to classical music. – The number of young people listening to rock music is more than listening to classical music.
The proportion of water used for agricultural purposes is smaller than that used in industries. — The amount of water used for agricultural purposes is less than the amount of water for industry.
Let’s pay attention to the difference between percent and percentage. The word percent is only used after a number. Percentage is used generically and can be used with countable and uncountable nouns:
The percentage of women knitting jumped to 45% in 2018. – The percentage of women knitting jumped to 45% in 2018.
The percentage of food people buy in supermarkets has increased in the last 2 years. — The percentage of food that people buy in supermarkets has increased over the past two years.
80 percent of the population did not come to the election. – 80% of the population did not come to the polls.
Grammar
If we use such words as a third, a quarter and the like, the preposition of is used after them.
A third of the students prefer studying abroad. A third of students prefer to study abroad.
The exception is half, after which you can either put or not put the preposition of.
Half ( of ) the children were dissatisfied. Half of the children were not satisfied.
Half ( of ) the population was ill. “ Half the population was sick.
Note that if the noun is plural, then the verb will also be plural.
Expressions like one in three and one out of five that are followed by a plural noun do not require a specific verb form after them. Both singular and plural can be used.
One in three men from the study says / say he never drives in bad weather. – Every third man in the experiment says that he never drives in bad weather.
IELTS Academic writing Task 1 – bar chart
Consider an example of a bar chart description.
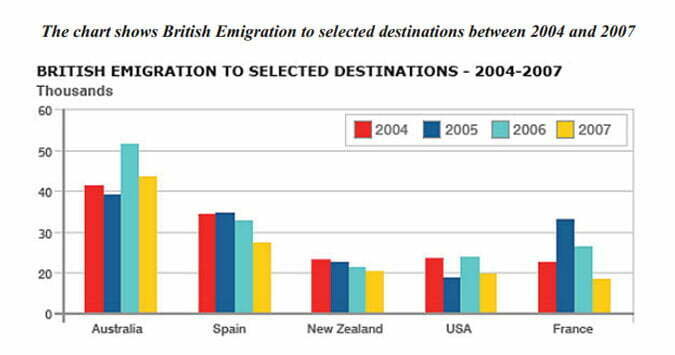
IELTS Academic writing Task 1 Bar chart Sample Answer
Structure
Introduction and summary
They are combined here in one paragraph. The summary begins with the words it is evident.
Made the following replacements:
British Emigration → British people who emigrated
between 2004 and 2007 → over the period 2004 to 2007, throughout the period
Paragraphs 1, 2, 3
The paragraphs are divided according to the popularity of countries among emigrants. Three countries of the leader are singled out, to which separate paragraphs are devoted. There are comparisons within paragraphs.
Vocabulary to describe bar chart in IELTS Academic writing Task 1
When describing a bar chart, you need to compare trends. We offer the following useful words and phrases:
| Word/Phrase |
|---|
| compared to |
| in compassion with |
| while, whereas |
| however |
| although |
| on the one hand, on the other hand |
| in contrast, by contrast |
| more … than |
| far less … than |
| as … as |
| like |
| twice as much/many as |
| three times more than |
| the same as |
| the chart compares … in terms of |
| to be by far the most |
| to be fairly similar to |
| in second place on the chart is |
| to be slightly higher than |
| with a similar proportion of |
| to double twofold, to increase twofold |
| a two-fold increase |
| to go up six times |
| six times higher |
| to fall by one fifth |
| to fall by half |
| to be one tenth the total |
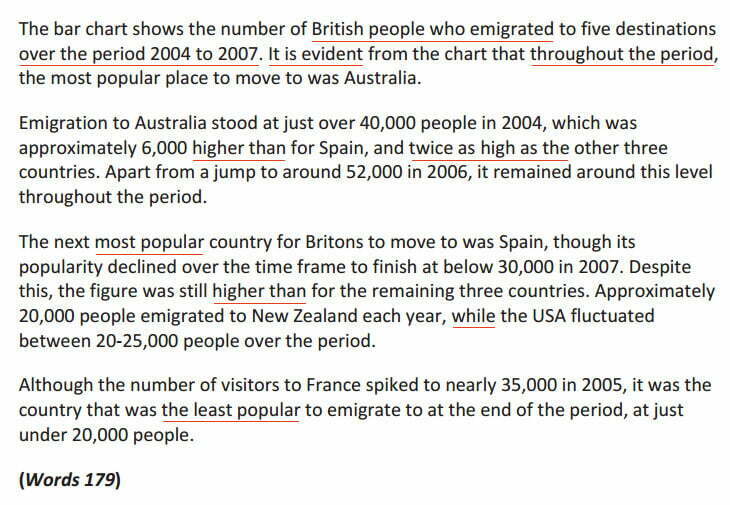
IELTS Academic writing Task 1 – Table
Consider an example of a table description.
IELTS Academic writing Task 1 table Sample Answer
Structure
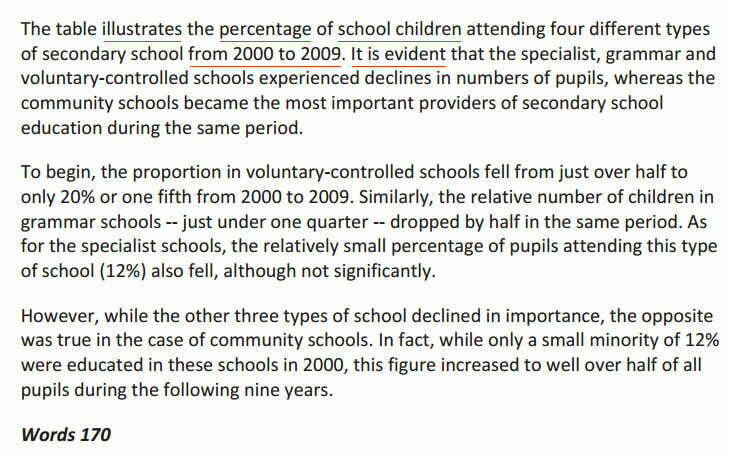
Introduction and summary
In the introduction, the task is paraphrased using the following synonyms:
shows → illustrates
proportion → percentage
pupils → school children
between 2000 and 2009 → from 2000 to 2009.
The summary begins with the words it is evident.
Paragraphs 1, 2
The paragraphs are divided according to the criterion of changes. The first paragraph describes the changes of a negative nature, and the second – a positive one.
Combined task
Consider an example of a description of a combined task.
Sample Answer
Structure
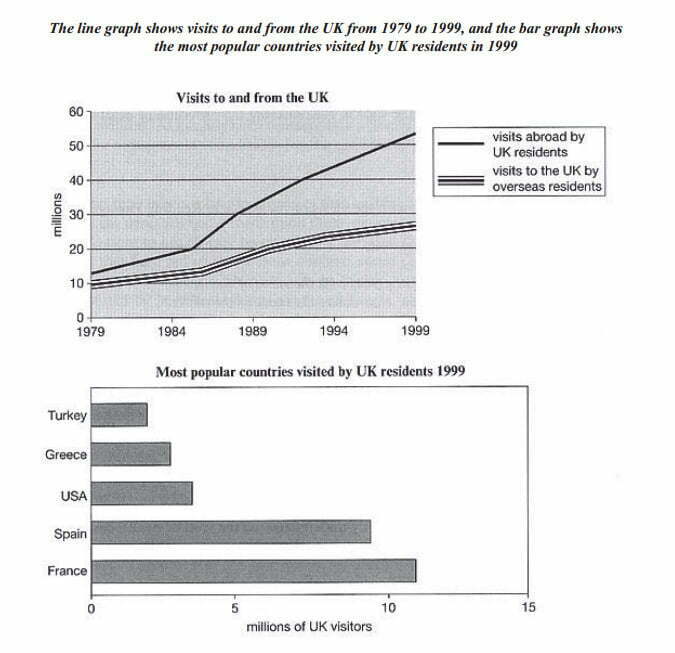
Introduction and summary
The task is paraphrased using synonyms, prepositions and cognates:
shows → illustrates
visits → visitors
to and from → went abroad and came
from 1979 to 1999 → between 1979 and 1999
the most popular → to be the most popular
In addition, both graphs are mentioned and the units of measurement are in millions.
The summary begins with the words overall, it can be seen that – it is important that it contains generalized information for both charts.
Paragraphs 1, 2
When describing a combined task, it is most logical to devote one paragraph to the first graph, and another to the second.
IELTS Academic writing Task 1 – Map
Consider an example of a map description.
IELTS Academic writing Task 1 map Sample Answer
Structure
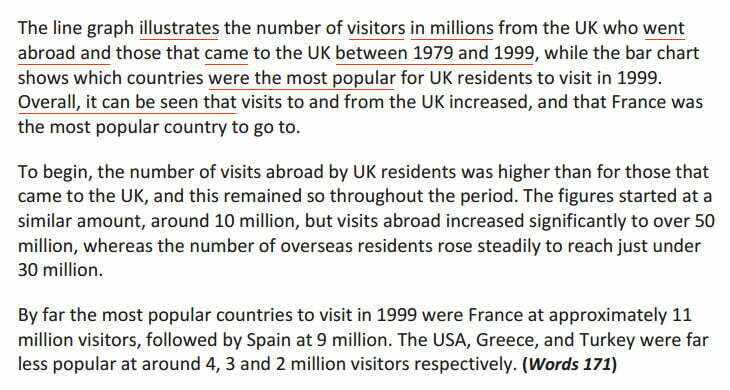
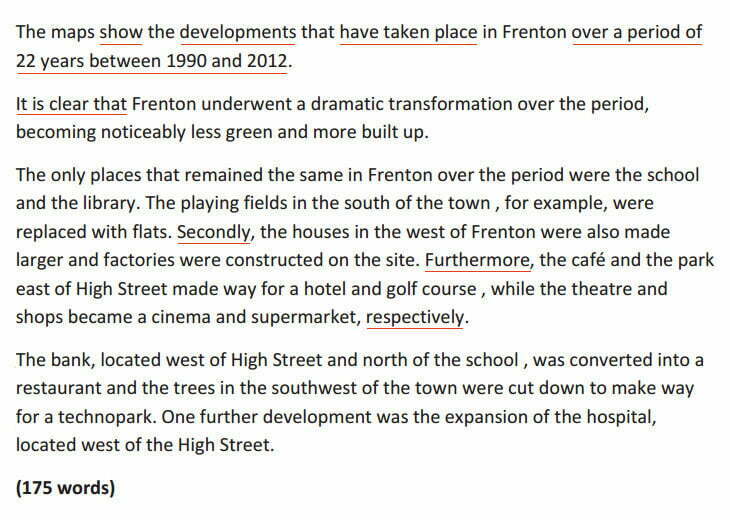
Introduction
The task is paraphrased with the help of synonyms, other grammatical constructions and prepositions:
illustrate → show
changed → developments have taken place
from 1990 to 2012 → over a period of 22 years between 1990 and 2012
Summary
The summary is introduced by the phrase it is clear that. The general impression of the changes over the past years is described.
Paragraphs 1, 2
Describing the changes in paragraphs, the author used connecting elements: secondly (secondly), furthermore (besides, moreover), respectively (in the specified order, as appropriate). Such words allow you to follow the train of thought, but they should not be abused, drawing attention to the elements, and not the essence of the analysis.
Vocabulary to describe a map in IELTS Academic writing Task 1
When describing a map, one cannot do without special vocabulary:
| Word/Phrase |
|---|
| north |
| east |
| south |
| west |
| population |
| a railway |
| a housing area, a residential area |
| a highway, a motorway, the main road |
| to be located, to be situated, to lie |
| to run through, to run across, to pass through, to go through |
| to enlarge |
| to expand, to extend |
| to develop |
| to demolish, to knock down, to pull down, to remove |
| to cut down trees |
| to construct, to build, to erect |
| to introduce changes |
| to add |
| to convert, to redevelop, to make into |
| to replace smth with smth |
| to modernize |
| to renovate |
Grammar
Speaking about the grammar needed to describe the cards, it is necessary to say about the tenses of the Perfect group. The Present Perfect is used when it is necessary to describe changes that have occurred recently and are still relevant. This time is used with markers such as since (since), recently (recently), lately (recently), over the period of time given (for a specified period of time).
Since 2015 , 2 new houses have been built . — Since 2015, 2 new houses have been built.
Over the last 20 years a few banks have appeared in the housing area. – Over the past 20 years , several banks have appeared in a residential area .
The Past Perfect is used when something has happened before a certain time in the past.
By 2015 , a new shopping mall had been erected in the city centre. — By 2015 , a new shopping center was erected in the city center.
Future Perfect time is essential when it comes to development plans.
By 2020 , 2 new kiosks will have been constructed next to the parking lot. — By 2020 , 2 new kiosks will be built next to the parking lot .
Another important grammatical construct for describing cards is Passive Voice. Since we cannot know who is initiating change or who is doing the work, passive sentences are used almost everywhere.
A new club was built in 2010. – A new club was built in 2010 .
The trees had been cut down by 2018. – By 2018, the trees had been cut down .
The central zoo will be renovated next year. The Central Zoo will be renovated next year .
When describing a map, it is important to indicate the location of objects.
Next to the theater there is an Italian restaurant. – An Italian restaurant next to the theatre.
A new cinema was built by the road. A new cinema has been built by the road .
The new park is in the south . — The new park is in the south .
| Word/Phrase |
|---|
| opposite |
| behind |
| in front of, before |
| along the road, up the road, down the road |
| across |
| in the neighborhood |
| nearby |
| over, above |
| under |
| among |
| between |
| from … to |
| near, next to, at, beside, by |
IELTS Academic writing Task 1 – Process
In this type of task, any illustrated process can come across, such as the manufacture of a substance, or the life cycle of an animal.
Consider an example of a process description.
IELTS Academic writing Task 1 process Sample Answer
Structure of describing a process in IELTS Academic writing Task 1
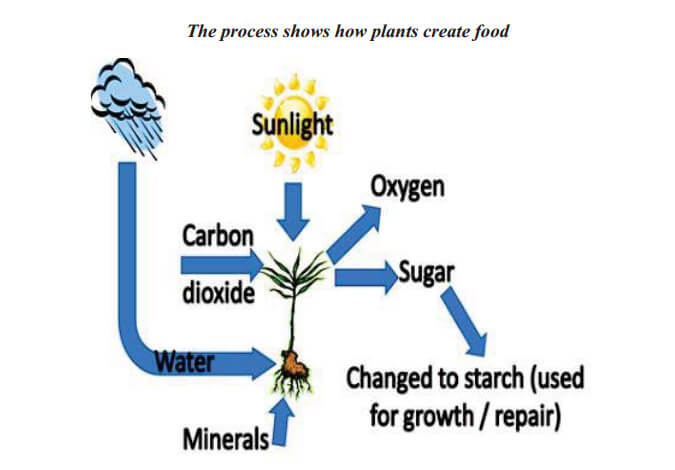
Introduction
The task is paraphrased using synonyms:
process → illustration
how … create → are able to produce
Paragraphs 1, 2
The paragraphs are divided into stages. The first paragraph describes how sugar is made, the second describes how it is used.
Summary
The summary is at the end of the work, it summarizes the number of elements of the process.
Vocabulary
First of all, you will need to indicate the stages of the process. It is important to know the words that describe the sequence of actions:
| Word/Phrase | Noun |
|---|---|
| firstly, secondly, thirdly | Firstly Secondly Thirdly |
| to begin | to start |
| then, next | after |
| following this | following this |
| in the subsequent stage | next step |
| followed by | followed by |
| finally | in the end |
| before (that) | before as |
| after (that) | after |
| once, as soon as | once |
| subsequently | after that |
| a stage of the process | process step |
| stage two | second phase |
| in the next stage, in the next stage | next step |
| in the previous stage | at the previous stage |
| in the first stage, in the initial stage | at the first stage, at the initial stage |
| in the last stage, in the final stage | at the last stage, at the final stage |
| in a later stage | at a later stage |
| the next step in the process | next step in the process |
| at this/that point | at this/that moment |
| in the first four stages | in the first four stages |
IELTS Academic writing Task 1 – Flow Chart
The flowchart of the algorithm is a step graph that shows a step-by-step algorithm of some procedure. It differs from the process in that it has no illustrations, only blocks and arrows. So any business process can be represented.
Let’s consider an example of the description of the flow chart in IELTS Academic writing Task 1.
Sample Answer
Structure
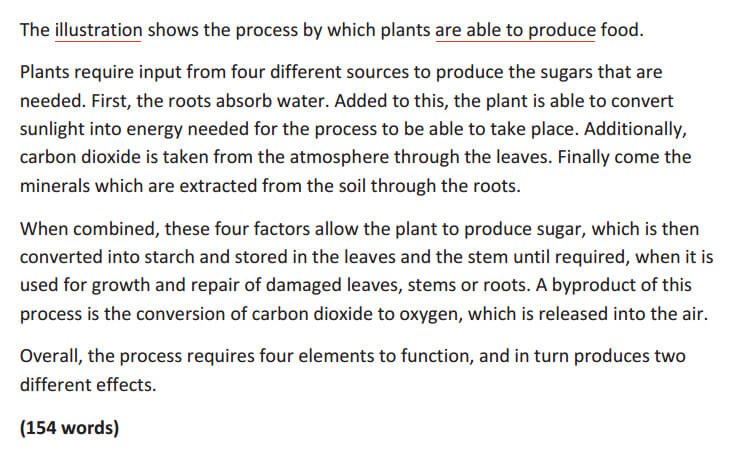
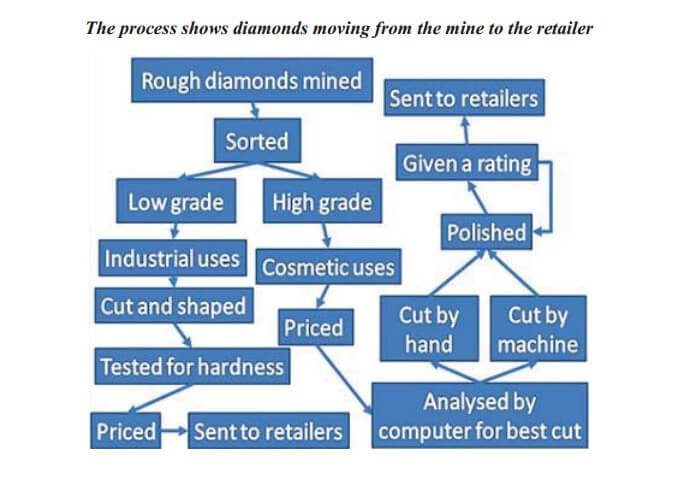
Introduction
The task is paraphrased using synonyms:
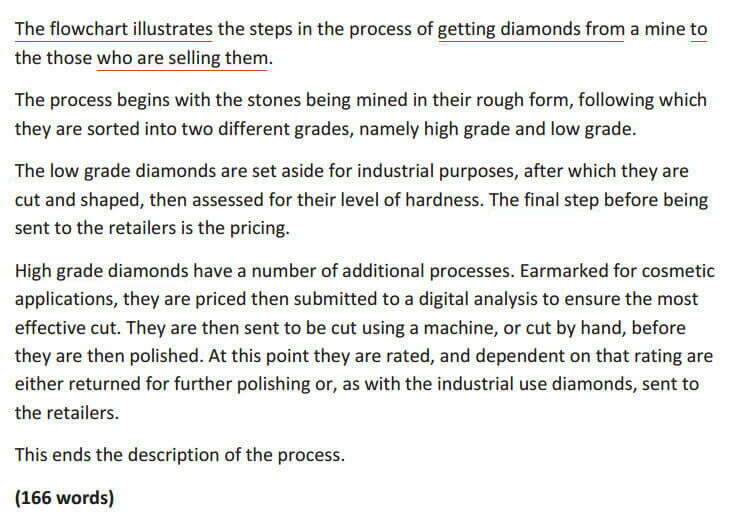
the process shows → the flowchart illustrates
diamonds moving → getting diamonds from … to
retailer → who are selling them
Paragraphs 1, 2, 3
The first main paragraph deals with how diamonds of different qualities are mined and sorted. The second paragraph is for low quality diamonds, and the third for high quality.
Summary
The summary states the fact of the completion of the process at a certain moment.
Mistakes and tips to get band 9 in IELTS writing task 1 academic
Common Mistakes
You don’t need to do the following:
- Spend more than 20 minutes on task 1. Spend 5 minutes planning and checking what you have written and 15 minutes writing your paper. The essay in the second part is rated higher, so we recommend spending the remaining 40 minutes on it.
- Repeat words and expressions from the task.
- Ignore resume. 1-2 sentences describing the overall picture must be present in the work.
- Carry out the entire analysis in one paragraph.
- Describe all the numbers that you see on the chart. You have to be selective. If there is a lot of information, something needs to be sacrificed. The key skill is to choose the main facts. If you need to describe a map or a process, it is important to understand that details cannot be excluded, as they are part of the whole picture.
- Describe each change or indicator individually or in turn. Remember that you need to show your analytical skills and benchmarking.
- Add facts that are not in the images (especially in maps and processes).
- Indicate your opinion or attitude to facts.
Helpful Hints to solve IELTS Academic writing Task 1 in 20 minutes
- Before you start practicing, read as many examples of answers with good scores as you can. Highlight key words and phrases in them to describe numbers, proportions, trends and changes. Pay attention to what grammatical constructions the authors use, how they divide the text into paragraphs, what information is included and what is omitted.
- Read the task carefully, highlight the key tasks in the description for it, as well as key indicators.
- Start your training by writing an introduction to each task. Practice rephrasing the task in several ways. The next day, write a summary of all those introductions that you have already prepared. And in a day, describe the trends, numbers and changes. Then check your work.
- Before writing paragraphs, clearly define for yourself by what criterion you share information.
- Compare trends as a whole, not individual numbers or endpoints. Analyze not only similarities, but also differences.
- Use short sentences, write only to the point. Use a moderate amount of connectors.
- Maintain a separate vocabulary by topic, such as expressions that describe an uptrend or words that describe fluctuations, etc.
- Exercise every day for 20 minutes. Leave yourself time to proofread your work.
Example of Task 1 question as in real IELTS exam
WRITING TASK 1
You should spend about 20 minutes on this task.
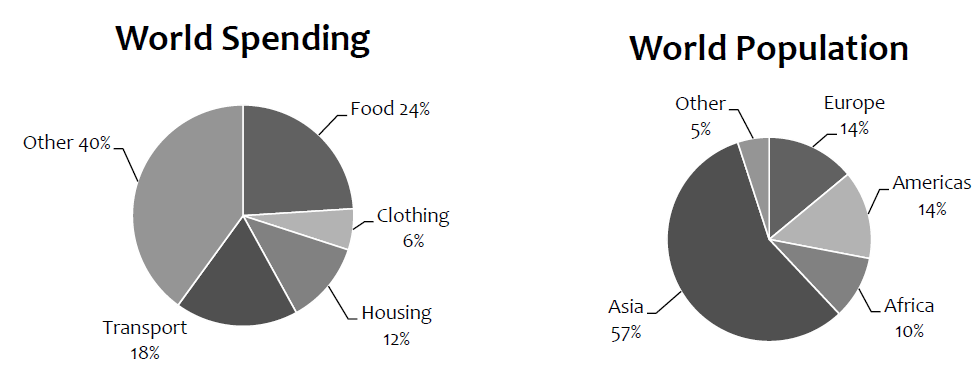
The charts below give information about world spending and population.
Summarise the information by selecting and reporting the main features, and make comparisons where relevant.
Write at least 150 words.
The writing Tasks
Tasks involve reporting the data in a visual item or a collection of data such as a table.
The task is to write a report:
- Summarise the information in the visual or set of data:
- Select the main features
- Report the main features
- Make comparisons were relevant
- Spend about 20 minutes on the task
- Minimum 150 words, up to165-170 words ((sometimes even more words are necessary to cover the main features of more detailed diagrams))
Note: Finish task 2 first before addressing task 1. Task 2 has twice as many marks as task 1 and is less flexible in terms of coherence and paragraphing, so if you do not get around to finishing it, you may lose more marks than when you leave task 1 unfinished.
The Answer Sheet
You will receive separate answer sheets for tasks 1 and 2, and the one for task 1 has red borders. Although you may ask for extra sheets to write your answer in, this is not likely to become necessary since the space you are already provided with is way more than sufficient. You must not write in the blank space at the bottom of the first page or in the scoring section at the bottom of page two. A copy of the answer sheet is available at the end of this course.
I want to improve my writing